
Most advice about optimizing a link in bio page skips the only question that decides whether any of it worked.
How will you know?
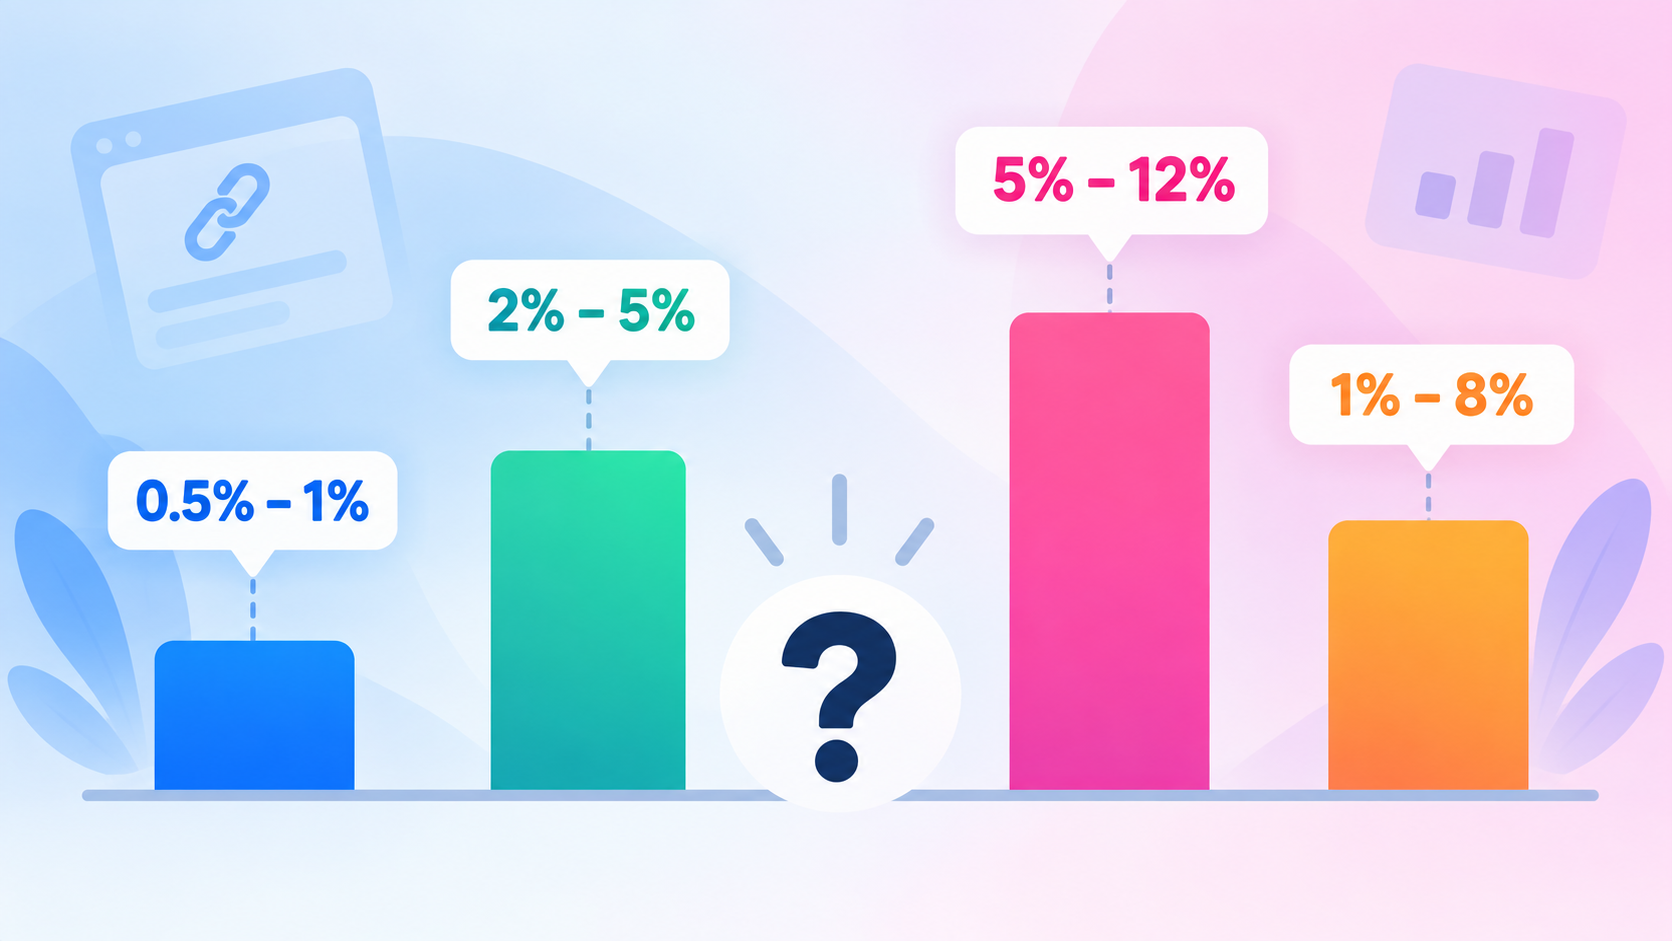
Search for a benchmark and you get numbers that cannot all be true at once, ranging from 1% to 30%, none with a stated methodology.
Meanwhile the formula everyone tells you to use quietly stopped meaning what it used to mean, because Meta changed the metric underneath it.
So this guide starts with measurement, then moves to the changes worth making, each tied to the number that proves it.
Key Takeaways
- There is no trustworthy published benchmark for link-in-bio click-through rate, so stop hunting for one and build your own baseline instead.
- Instagram’s profile views metric counts organic activity only, while the older profile impressions metric counted paid too, so boosted posts now make your click-through rate look better than it is.
- Instagram Insights needs a Professional account and keeps account-level data for roughly 90 days, so many people cannot even calculate the standard formula.
- Bot clicks sit in the denominator of every rate you calculate, which makes an unfiltered conversion rate close to meaningless.
- Change one thing, watch the metric closest to that change, and compare the same traffic source before and after.
What Is a Good Link in Bio Click-Through Rate?
Nobody credible knows.
That is the honest answer, and it is more useful than a made-up number.
Here is what is actually in circulation.
| Published figure | Claimed by | Methodology published? |
|---|---|---|
| 1% to 3% CTR | Hopp, a link-in-bio tool | No |
| 2% to 5% average, 15% to 25% optimized | Trustypost, an analytics blog | No |
| 15% to 30% for top creators, 350% lift from optimization | A marketing newsletter | No |
| 1% to 3% CTR, then around 1.08% conversion after the click | Another marketing newsletter | No |
Two of them treat 3% as a ceiling and two treat 15% as achievable, so they cannot possibly be describing the same metric.
Why the published numbers disagree
A rate needs a numerator and a denominator, and none of these sources states theirs.
The same traffic produces wildly different percentages depending on what you divide by:
- Clicks ÷ profile visits gives the lowest number, because most profile visitors never tap anything.
- Clicks ÷ followers can exceed 100%, because non-followers visit too.
- Clicks ÷ page views gives the highest number, because it only counts people who already arrived.
- A bot-inflated denominator pushes the result down, and a paid-traffic gap pushes it up.
As CXL’s benchmark guide puts it for advertising, click-through rate varies so much by channel, format, and placement that a single cross-industry average tells you very little.
Bio pages are worse, because the traffic source is a social profile whose own metrics keep changing.
What to use instead of a benchmark
Your own number from last month.
That is the only comparison that controls for your niche, your audience, your platform mix, and your offer.
A page moving from 4% to 6% is a real 50% improvement.
A page sitting at 12% while a blog post insists the average is 3% tells you nothing, because you do not know what that 3% was counting.
Why the Standard CTR Formula Now Misreports
Every guide gives you the same formula.
Divide bio link clicks by profile visits, then multiply by 100.
The formula is fine.
The problem is that the denominator changed definition, and almost nobody writing about bio pages noticed.
Views replaced impressions in April 2025
Meta swapped the underlying metric, and the dates matter if you are comparing old numbers to new ones:
impressionswas replaced byviewsas the headline metric in Graph API v22.0 on 21 April 2025.- The old metric was deprecated for media created on or after 2 July 2024.
viewsincludes replays, so one person watching twice can count twice.
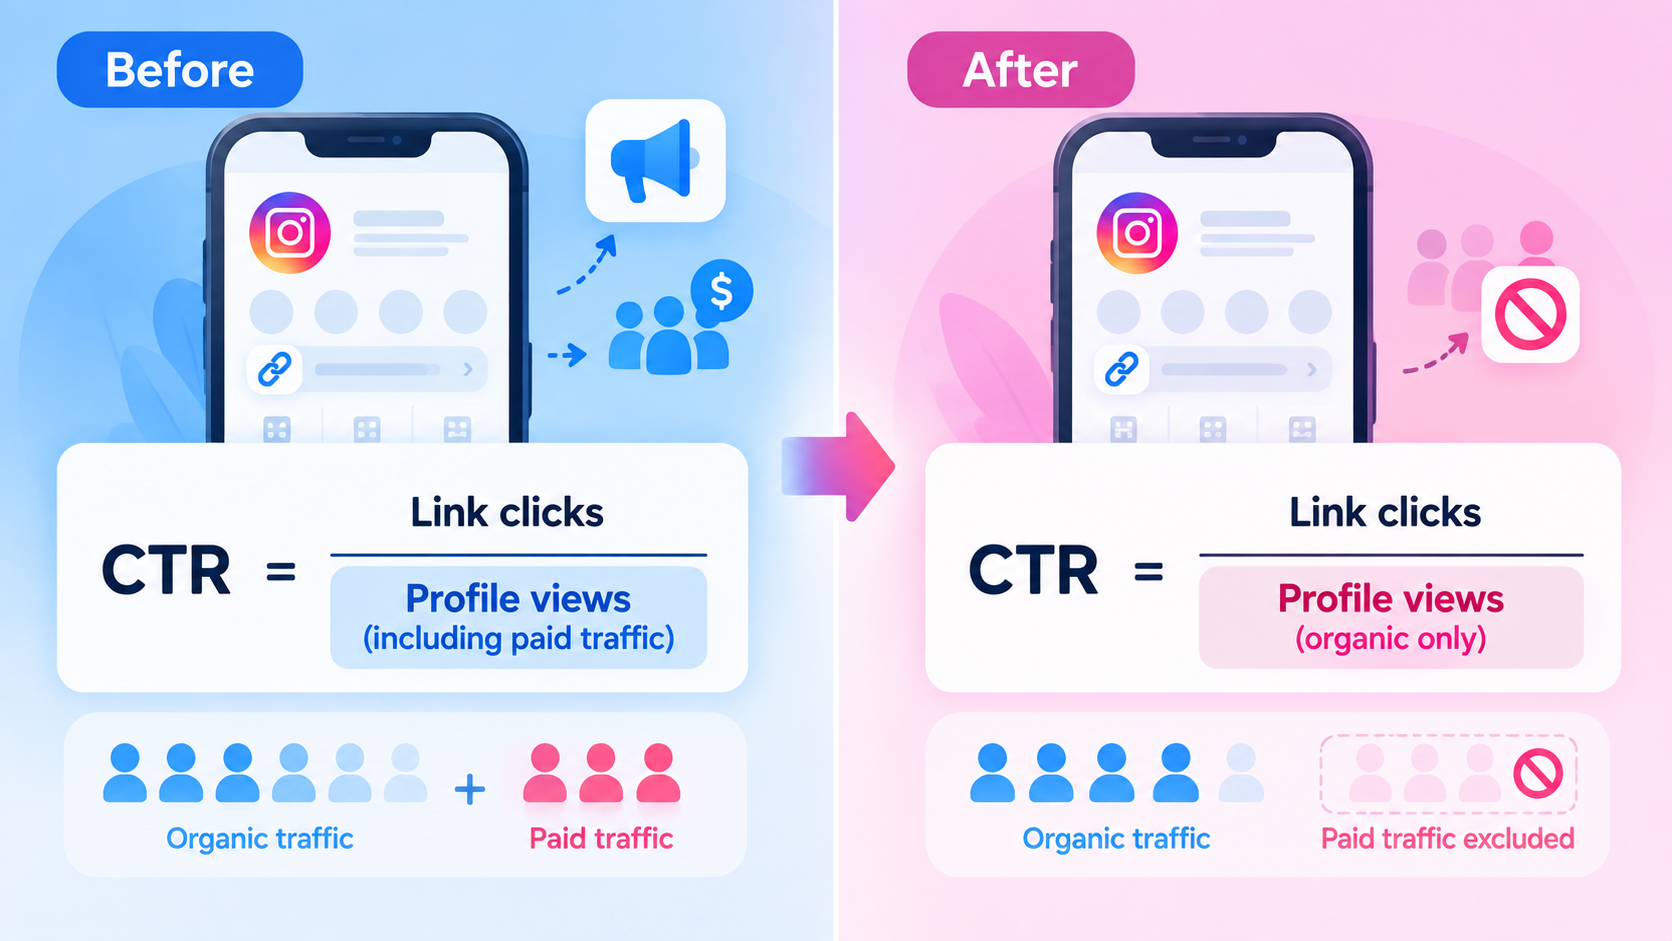
Profile views counts organic only
This is the detail that changes your math.
According to Hootsuite’s help centre documenting the change, profile impressions counted both organic and paid activity, while profile_views counts organic data only.
So if you boost posts, your denominator shrank while your clicks did not, and your click-through rate rose without a single change to the page.
If you compare a number from early 2025 against one from today and conclude your optimization worked, you may be looking at a metric definition change instead.
You need a Professional account to see it at all
Instagram Insights is only available on Professional accounts, meaning Business or Creator.
A personal account gets no profile visits figure, so the standard formula is not available to that reader no matter how many guides recommend it.
Switching account type is the fix, and it takes effect going forward, not retroactively.
The history is about 90 days deep
Account-level Instagram data is retained for roughly 90 days, in 7, 30, and 90 day windows.
That means you are the only one who will ever have your long-term baseline, so write the number down monthly.
Clean the Denominator Before You Judge Anything
Bot clicks land in your page views, and page views are the denominator of your widget click rate.
A creator in our community summed it up: total visits include bots, which makes the number close to useless, and calculating a conversion rate from it is impossible.
Why bots break a rate worse than they break a count
An inflated click count is annoying but obvious, while an inflated denominator is invisible and moves your rate the wrong way.
The sequence looks like this:
- Bots load the page, so page views rise.
- Bots tap nothing, so widget clicks stay flat.
- Your click-through rate falls, and the page looks like it got worse.
- You change a page that was never the problem.
What to do about it
- Use a tool that reports human clicks separately instead of one blended total.
- Turn on bot filtering on the page and on any short links pointing at it.
- Ignore the first day or two of a brand new link, because fresh links attract scanners immediately.
- Exclude your own visits before you read anything into a small number.
Our guide to bot traffic in link analytics covers how the filters work and where they fail, including the honest tradeoff that strict filtering also blocks a small number of real people.
Set Your Baseline in One Sitting
This takes about twenty minutes and it makes everything after it meaningful.
Pick the one rate that matches your question
Different questions need different rates, and using the wrong one is how people conclude a good change failed.
| Your question | Rate to use | What moves it |
|---|---|---|
| Are people tapping my bio link at all? | Profile to page | Your bio text, profile, and content, not the page |
| Is the page doing its job? | Page views to widget clicks | Layout, labels, and how many choices you offer |
| Is the destination holding them? | Widget clicks to destination visits | Load speed, in-app browsers, and the route itself |
| Am I actually earning? | Destination visits to conversions | The offer and the destination page |
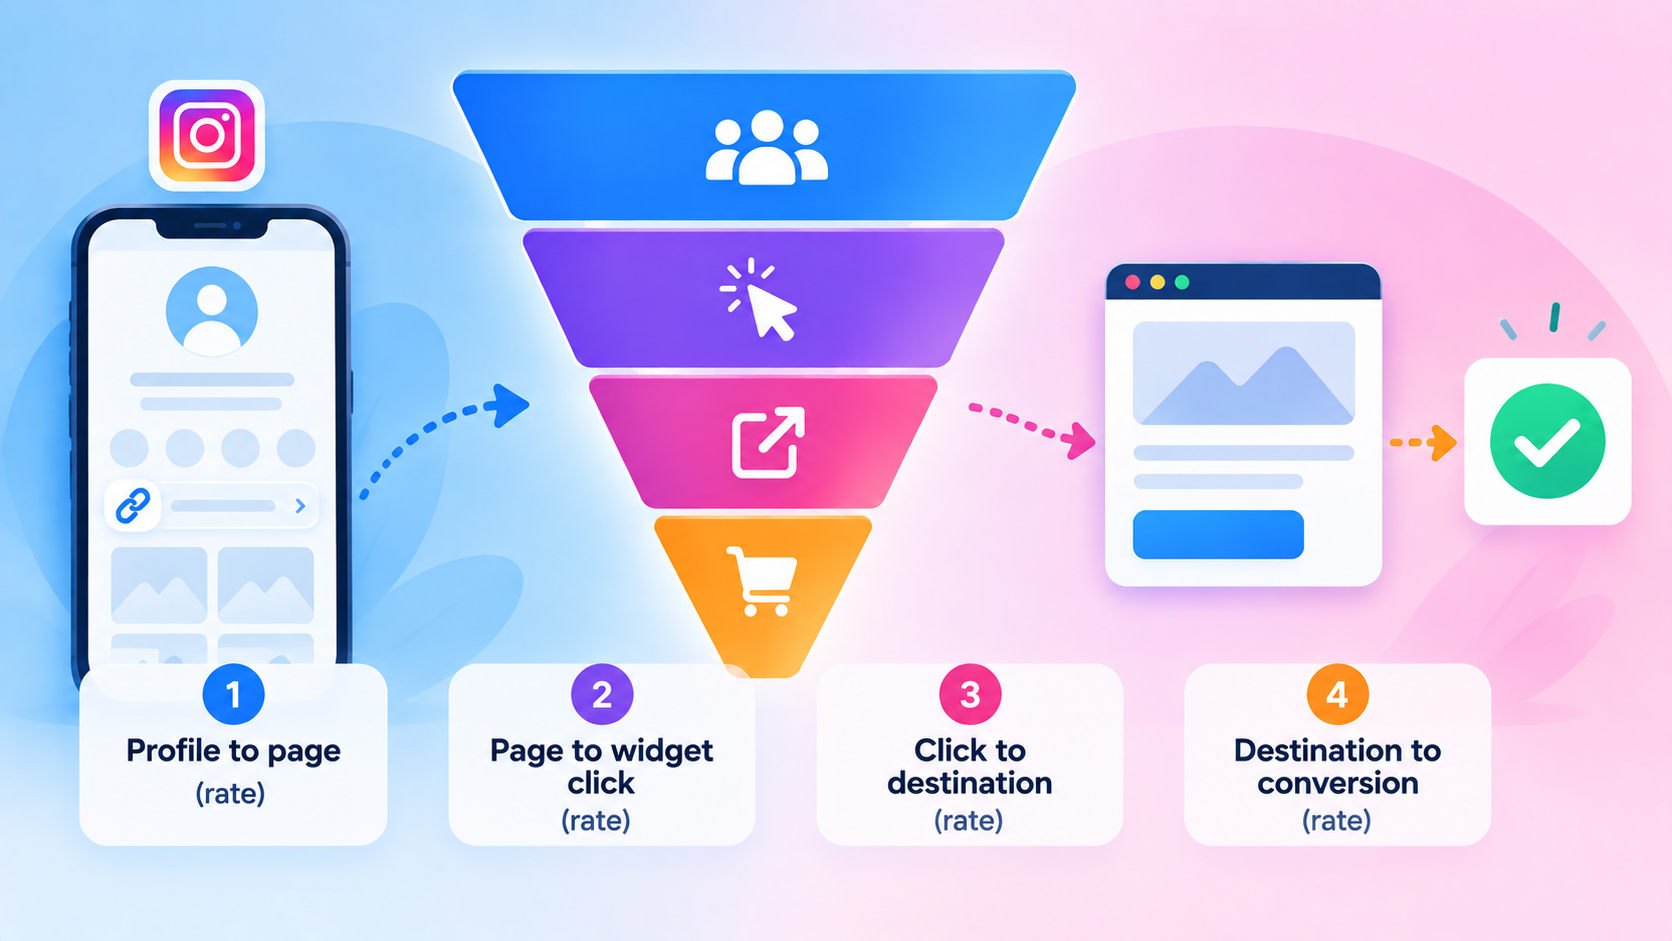
A layout change should move the second rate before it moves the fourth.
If you only track the last one, every test looks inconclusive.
Our complete link in bio guide sets out each formula in full, along with page contents, link labels, and how many links to use.
Write the starting numbers down
- Page views and unique visitors for a fixed window, usually the last 30 days.
- Widget clicks for every link on the page, not just the main one.
- Your top two or three referrers, so you can compare like with like later.
- The date, and a one-line note on what the page looked like.
Keep it in a spreadsheet, because dashboards roll over and platform history expires, and your baseline should outlive both.
Decide the test window before you start
- Make it long enough to collect a few hundred page views.
- Use a whole number of weeks, because weekday and weekend behaviour differ.
- Write the end date down, so a good Tuesday does not tempt you into stopping early.
The Changes Worth Making, Ranked by Leverage
These are ordered by how much they typically move, not by how easy they are.
For each one: what to change, which number should react first, and how soon you will know.
1. Question whether you need the page at all
The highest-leverage change is often removing a step rather than improving one.
If a campaign has exactly one destination, a page in the middle is a tax on every visitor.
Our comparison of direct links and landing pages covers when each route wins and what the platforms allow.
2. Fix the mobile route before the design
A page that works in Safari can still fail inside Instagram’s built-in browser, where logins and saved payment methods behave differently.
This is a route problem, not a layout problem, and no amount of button tweaking fixes it.
Read getting out of in-app browsers if the destination misbehaves, or Instagram bio link not working if the link will not open at all.
3. Make one action obvious
A page with a single clear primary action beats a page offering six equal options.
Use a featured or highlighted link style for the current priority and let everything else sit visually below it.
A page whose top link takes 70% of clicks is working, even if total clicks are flat.
4. Match the page to the post that sent the traffic
A visitor arriving from a specific video expects to find that thing near the top, and a generic page asks everyone to hunt for their own reason for being there.
Tag your traffic with utm_source, utm_medium, and utm_campaign so you can see which source wanted what, using the method in our UTM tag guide.
Read the result by referrer, because one strong source can hide a weak one.
5. Schedule offers instead of stacking them
Most pages get worse by accumulation, not by bad design.
Old campaigns stay live, new ones get added, and every visitor pays for the clutter.
Set an expiry date when you add an offer, not after it goes stale.
6. Target by country and language
One page serving several regions usually underperforms for all of them.
Showing region-specific widgets only where they apply removes irrelevant choices without deleting anything.
Expect a higher click rate with flat page views, which is the shape you want.
7. Test the destination, not just the page
Sometimes the page is fine and the destination is the weak link.
Pointing the same button at two different destinations and comparing outcomes separates the two.
This is a short-link capability rather than a page feature, which matters for what it costs.
| Change | Metric that moves first | Realistic wait |
|---|---|---|
| Removing a step in the route | Clicks to destination visits | 1 to 2 weeks |
| Fixing the in-app browser path | Destination visits, then conversions | Days, the effect is usually obvious |
| Promoting one primary action | Share of widget clicks on that link | 2 weeks |
| Matching page to source | Widget click rate by referrer | 2 to 4 weeks |
| Removing expired offers | Widget click rate overall | 2 weeks |
| Country or language targeting | Widget click rate in that region | 2 to 4 weeks |
| Destination testing | Conversions per click | Until a few hundred clicks land |
What Counts as a Real Improvement?
Small numbers lie confidently
Going from 3 clicks to 6 clicks is not a 100% improvement, it is three clicks.
Wait for a few hundred page views before treating a difference as real.
Compare the same traffic source
A page can look transformed because a video did well, not because you changed anything.
Compare one referrer against itself across the two windows.
If the gain only shows up in aggregate, it was traffic mix rather than the page.
Keep a change log
Four columns are enough:
- What you changed, in one line.
- When you changed it.
- The metric you expected to move.
- What actually happened, including when nothing did.
Recording the failures is what stops you re-testing the same idea next quarter.
What Linko Gives You for This
Measurement
- Page views and unique visitors, plus widget click tracking with per-link counts.
- Referrer, geographic, device, browser, and language data, with hourly and activity charts.
- Eleven date-range presets including All Time, which helps when platform history has expired.
- Shield Protection to filter bots, available from the Starter plan on both Bio Pages and short links.
Levers on every plan, including Free
- Widget scheduling, expiry, and a disable toggle that hides a widget without deleting it.
- Bio Page country and language targeting.
- Bulk widget reordering, and a Featured Link style for the current priority.
- 48+ widgets and 35+ themes.
The plan detail worth knowing is that Bio Page geo and language targeting is included on every plan, while link-level geo, device, and language targeting starts on Pro.
What is not there
- No heatmaps and no scroll-depth tracking, so widget clicks are your signal for what people engage with.
- A/B testing is a short-link feature for testing destinations, and it does not unlock until the Business plan at $79 per month.
- There is no widget-level split test, so page changes are measured before and after rather than side by side.
If you only need a bio page, cheaper single-purpose tools exist and we say so in our comparisons of Linktree and Link.me.
Linko earns its price when you need the page, the short links behind it, and the reporting to be one system.
Frequently Asked Questions
What is a good link in bio click-through rate?
There is no reliable published figure, and the numbers in circulation range from 1% to 30% without any stated methodology.
Use your own rate from the previous month as the benchmark instead.
Why did my bio link click-through rate suddenly improve?
Check whether you started boosting posts.
Instagram’s profile views metric counts organic activity only, so paid reach no longer enlarges your denominator and the rate rises on its own.
Can I calculate my bio page CTR on a personal Instagram account?
No, because Insights requires a Professional account, meaning Business or Creator, and without it there is no profile visits figure to divide by.
How long should I wait before judging a change?
Long enough to collect a few hundred page views, ideally a whole number of weeks, which on a typical creator page means around two.
Should I test two versions of my page at once?
On a bio page you normally cannot, because split testing widgets is not a standard feature.
Test before and after on the same traffic source, or test the destination behind the button instead.
Do bots really affect my click-through rate?
Yes, and they usually make it look worse than it is, because bots add page views without adding clicks.
Measure First, Then Change One Thing
The reason optimization advice feels unreliable is that most of it cannot be checked.
A tip without a metric is a guess with confidence attached.
So do the unglamorous part first:
- Filter the bots so the denominator is real.
- Pick the one rate that matches the question you are asking.
- Write down where you are starting.
- Set the window before you begin, not after.
Then change one thing and let the number closest to it answer.
You will make fewer changes that way, and you will keep the ones that worked.
If you want the page, the links behind it, and the reporting in one place, you can start a free Linko account.
Comments